
Think of a fuel hose. At one end, oil companies pump crude and refineries turn it into gasoline, diesel and jet fuel. At the other end, airlines and trucking companies pay for every gallon. When oil gets more expensive, money flows down that hose from one end to the other.
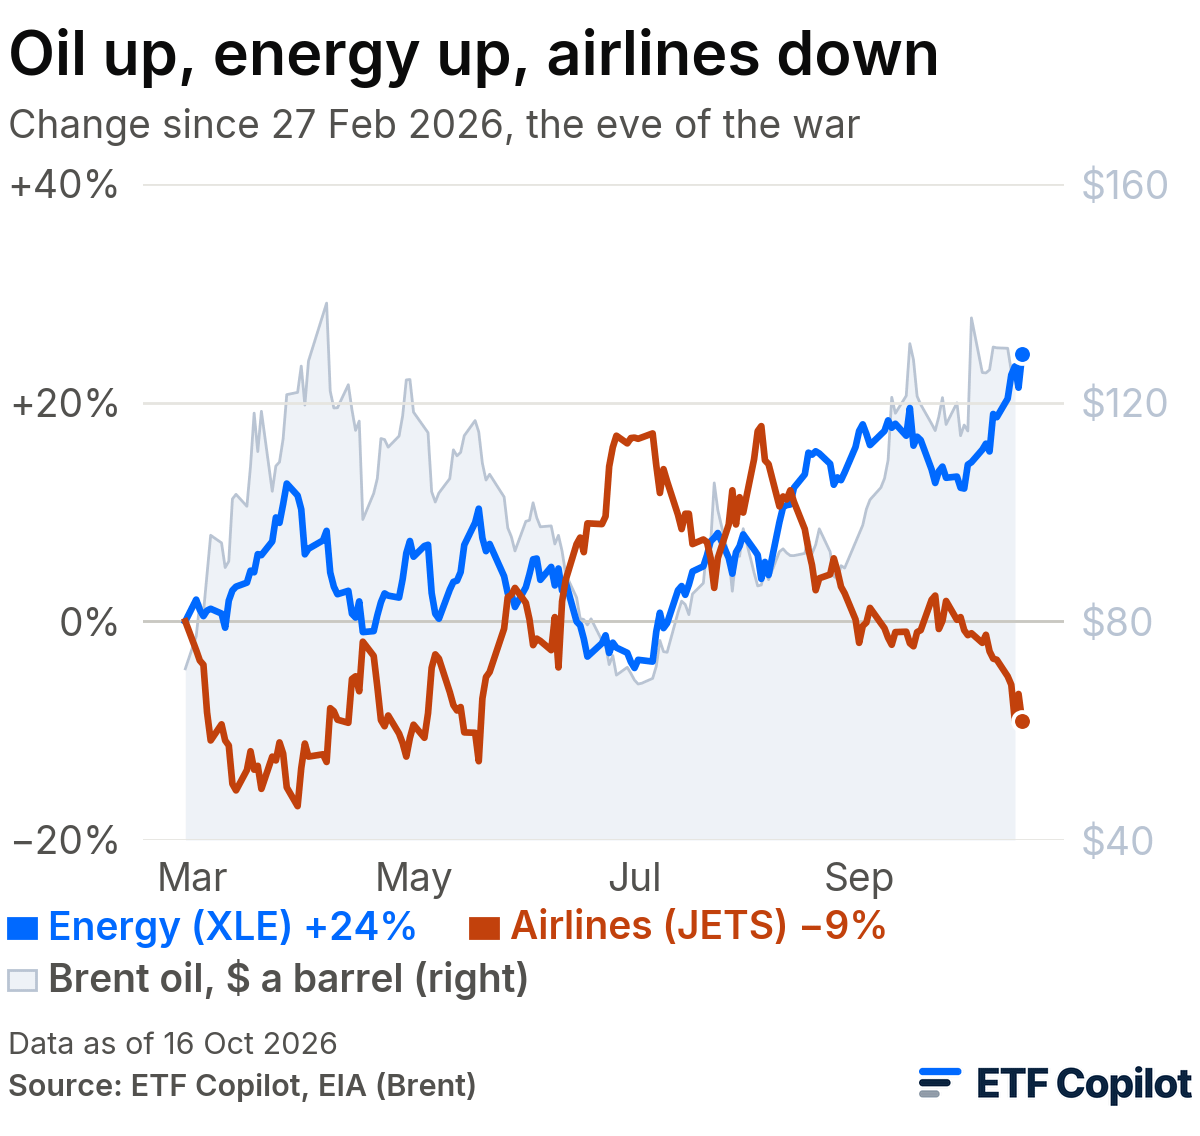
That is what has happened since the Iranian war started on 28 February 2026. Brent crude, the global oil benchmark, went from $71 a barrel on the eve of the war to $127 on 14 October, by the daily spot price of the US Energy Information Administration.
Who gained and who paid
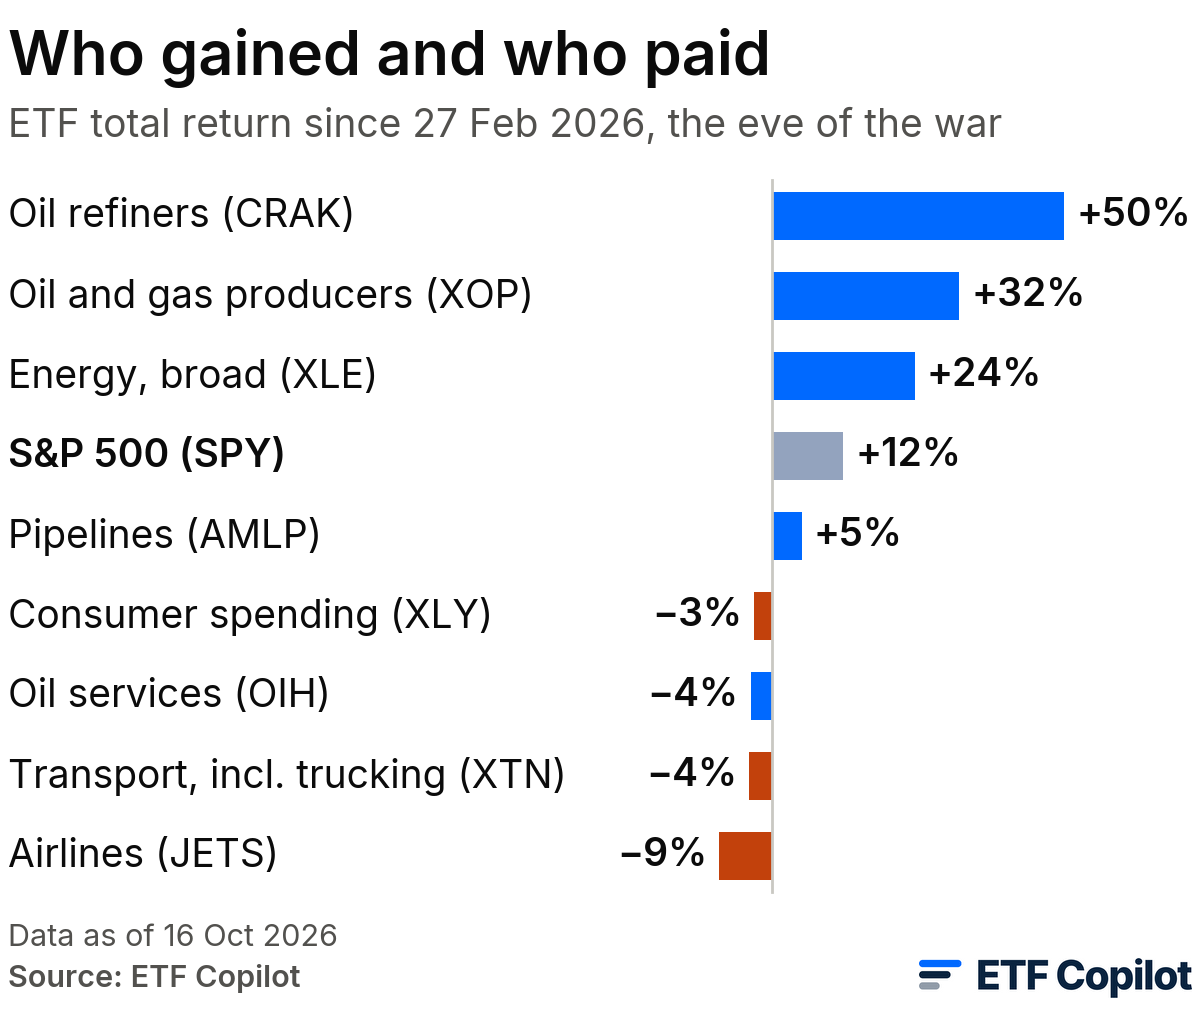
Energy funds collected. XLE, the biggest energy ETF, returned 24% from the last close before the war to 16 October, twice the S&P 500’s 12%. JETS, the main airline ETF, lost 9%.
The path had two peaks. Oil hit $138 in early April, slid to about $69 by early July, then climbed again from August. As oil fell, the airline fund pulled ahead of the energy fund from mid-June to mid-August, by the widest margin in early July, which shows the hose works in both directions.
Elsewhere on the paying end, the losses were smaller. Transport funds such as XTN, where truckers and airlines each make up about a fifth of the fund, fell 4%. Consumer stocks (XLY), the companies that live on household spending, slipped 3%.
Refiners led, oil services lagged
Inside energy, the gains went to the companies closest to the barrel. Refiners (CRAK) returned 50% and oil and gas producers (XOP) 32%. Their profits explain it: the earnings of the refiners inside CRAK have more than doubled since February, and the producers’ earnings are up about 60%.
Two corners of energy were left behind. Pipeline funds (AMLP) returned 5%: pipelines mostly earn fees on the volumes they carry, so a higher oil price helps them less. Oil services funds (OIH), which sell drilling equipment and services to the producers, lost 4%, and the earnings of the companies inside are about where they were before the war.
What energy funds cost now
After a run like this, the question is how much good news is already in the price. One simple check is the P/E ratio, the price against the past year’s profits, set against the fund’s usual level.
XLE, the biggest energy fund, trades at 19x its past year’s profits against a usual 16x. Oil and gas producers sit even further above their usual level, while refiners and pipelines are close to normal.
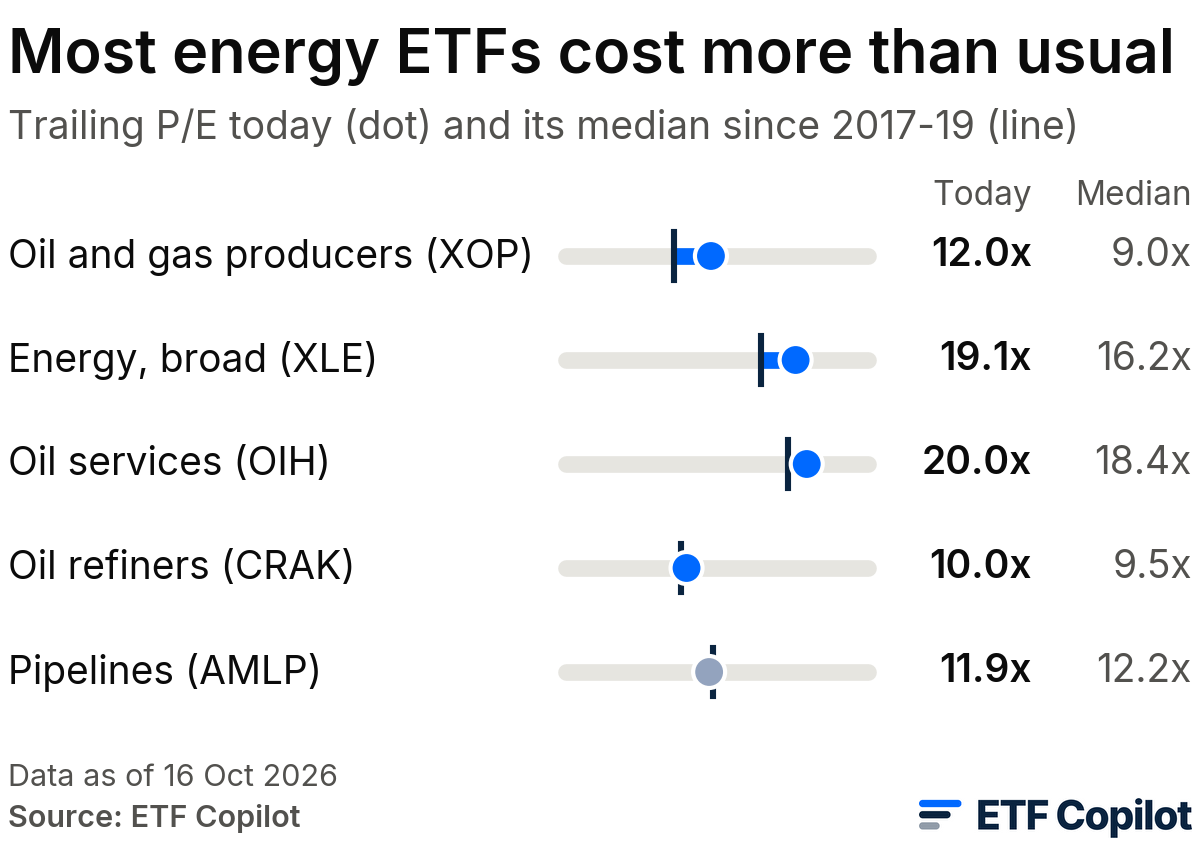
That is what “priced for $100 oil” means: today’s prices assume the profits that high oil brings will last. If oil falls back, money may flow back down the hose toward airlines and truckers, as it did over the summer.
Earnings season puts numbers on it
The next two weeks show both ends of the hose in figures. American Airlines and Southwest report quarterly results on 22 October, and ExxonMobil on 30 October. Those reports show how much of oil’s jump has reached the profits of the companies that sell it and the companies that burn it.
To see every energy fund we cover, what each holds and how its valuation compares with its history, visit our energy ETF page.
See the full breakdown on ETF Copilot: etf-copilot.com/go/substack/energy-vs-airlines
Written by the ETF Copilot research team. Data as of 16 October 2026. This is not investment advice or a recommendation to buy or sell any security. ETF Copilot receives no compensation from the issuers of the funds mentioned. Managers of ETF Copilot may or may not hold positions in the funds mentioned.
Sources: Europe Brent spot price, US Energy Information Administration; ExxonMobil third-quarter 2026 results date; Southwest Airlines third-quarter 2026 results date; American Airlines third-quarter 2026 results date.
The finding that refiners (CRAK) returned 50% versus 32% for producers fits nicely with the idea that profits sit closest to the barrel. Given energy funds look priced for oil to stay above $100, how would you think about the risk if prices slide back like they did in July?